
Quick Start
This walkthrough uses a Linux capture host at 192.168.1.10 and an eCaptureQ computer at 192.168.1.20 on the same trusted LAN. Replace these example addresses with your own. eCaptureQ can run on Windows, macOS or Linux; if both programs run on one Linux host, use the same-host address below. Only capture a program and traffic you are authorized to inspect.
1. Prepare the collector
On the Linux capture host, download eCapture. The published v2.10.0 exposes --ecaptureq and --text-source pcapng; check your downloaded build before starting:
./ecapture tls --helpThe interface and a compatible Decryptor are required for the full-message path below. A successful eCaptureQ connection cannot add fields or protocol support that the collector does not supply. See protocol requirements and the upstream compatibility record. eCapture requires a supported Linux/Android kernel and capture privileges; macOS and Windows support here applies to eCaptureQ.
2. Start eCapture's event listener
On the Linux capture host (192.168.1.10), in the extracted eCapture directory, run this example for a supported OpenSSL TLS application:
sudo ./ecapture tls -m text --text-source pcapng -i eth0 \
  --ecaptureq ws://0.0.0.0:28256/
Replace eth0 with the interface carrying the target traffic (lo for local loopback). Keep this process running and check its startup log for successful probe attachment and event listening. Select gotls --elfpath /path/to/go-app for a Go TLS executable, or gnutls --gnutls /path/to/libgnutls.so for a GnuTLS application. BoringSSL/LibreSSL targets may need explicit library/version selection; see Protocols & Details.
Here --ecaptureq is the listen address opened by eCapture. 0.0.0.0:28256 listens on the capture host's IPv4 interfaces; allow TCP port 28256 from the eCaptureQ host (192.168.1.20) in the capture host's firewall. For same-host use only, bind to ws://127.0.0.1:28256/ instead. Do not substitute --eventaddr, which is a different output interface.
3. Choose the connection address
Use the capture host's address that eCaptureQ can reach:
| Your setup | Address entered in eCaptureQ |
|---|---|
Same LAN: capture host 192.168.1.10, eCaptureQ host 192.168.1.20 | ws://192.168.1.10:28256/ |
Public address 203.0.113.10 forwards port 28256 to the capture host | ws://203.0.113.10:28256/ — address-mapping example; use the protected connection described below |
| Both programs on one Linux host | ws://127.0.0.1:28256/ |
Replace the documentation-only address 203.0.113.10 with your own. Public access requires a protected link or an existing TLS/WSS endpoint, plus a firewall/security-group rule limited to the eCaptureQ host's egress IP: native ws has no authentication or transport encryption. See public connection and NAT details.
Desktop makes this connection from its own computer; Web makes it from the Web service host. Never enter 0.0.0.0 as the destination, or use 127.0.0.1 to mean another machine.
4. Open eCaptureQ
Install Desktop or Web on the analysis computer/service host (192.168.1.20 in this example). Open Desktop directly. With the Web package, start:
# Linux, after installing the Web package
ecaptureq-web --addr 127.0.0.1:28257
# macOS, in the extracted ZIP directory
./ecaptureq-web --addr 127.0.0.1:28257
On Windows use .\ecaptureq-web.exe with the same arguments. Open http://127.0.0.1:28257/ on that host. To open the page from another computer, see remote Web access.
28256 is the collector event port; 28257 is the Web page port. Opening the Web page proves browser-to-service connectivity, not service-to-collector connectivity.
5. Add a source and switch to Live
- Open the source status button at the top right and choose Add source (添加数据源 in Chinese).
- Enter a descriptive name and
ws://192.168.1.10:28256/for the LAN example. For another setup, use the address from step 3. - Choose Add and connect (添加并连接). Confirm the source shows connected and the connected/total count increases.
- Switch the top mode control to Live (实时). Adding a source does not switch the displayed mode automatically.
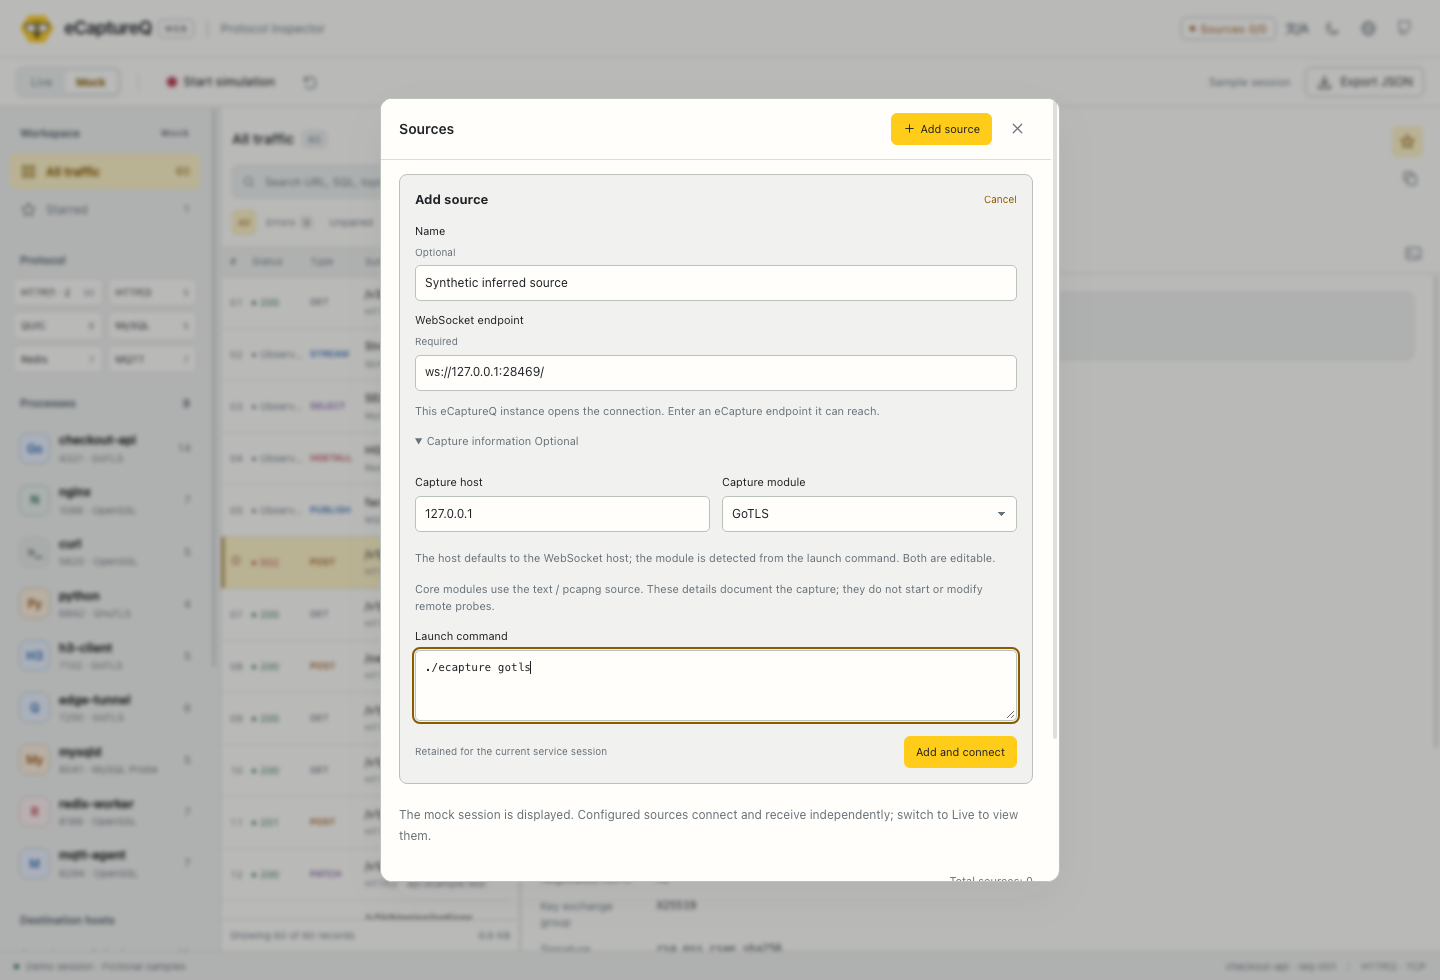
Click to enlarge. Real eCaptureQ v1.0.0 Web UI using synthetic setup data.
The launch command field is only a description. It does not start eCapture, log in to the host or change a remote probe.
6. Generate traffic and inspect a record
On the capture host, first use curl -V to confirm this example curl is linked with OpenSSL, then generate a request after capture starts:
curl -V
curl --http1.1 https://example.com/
You can replace the example URL with your own HTTPS service. If your curl uses another TLS backend, select the corresponding supported probe instead. A Go application must use the gotls probe and matching executable path. The request must cross the interface selected above.
Back in eCaptureQ, clear any filters. New records should appear in Live mode. Select one, open Request, Response, then Connection to inspect messages and available process/TLS metadata. A connected source with no records means the event channel is open; check the target, module, interface and source logs before assuming capture succeeded.
Continue with the three-pane exercise. For several collectors, repeat the source setup with each reachable endpoint.
Try Mock without a collector
Open eCaptureQ without any source. Its default Mock mode contains 60 synthetic records across nine processes. Select a process and protocol, then inspect the messages. Start simulation appends fictional samples; the Reset demo data icon restores the initial set. Mock and Live data remain separate, and demo timing/correlation is fictional.
You can switch back to Mock while live sources remain connected. Mode changes affect what is displayed, not background reception. This is a local product demo; this documentation website does not connect to your collectors.