
Interface Guide
Work from left to right: choose a scope → select a record → inspect its message. Desktop and Web share the analysis interface.
The screenshot shows the real eCaptureQ v1.0.0 Web interface with bundled synthetic data. Its numbered overlays identify the three panes; no real capture is shown.
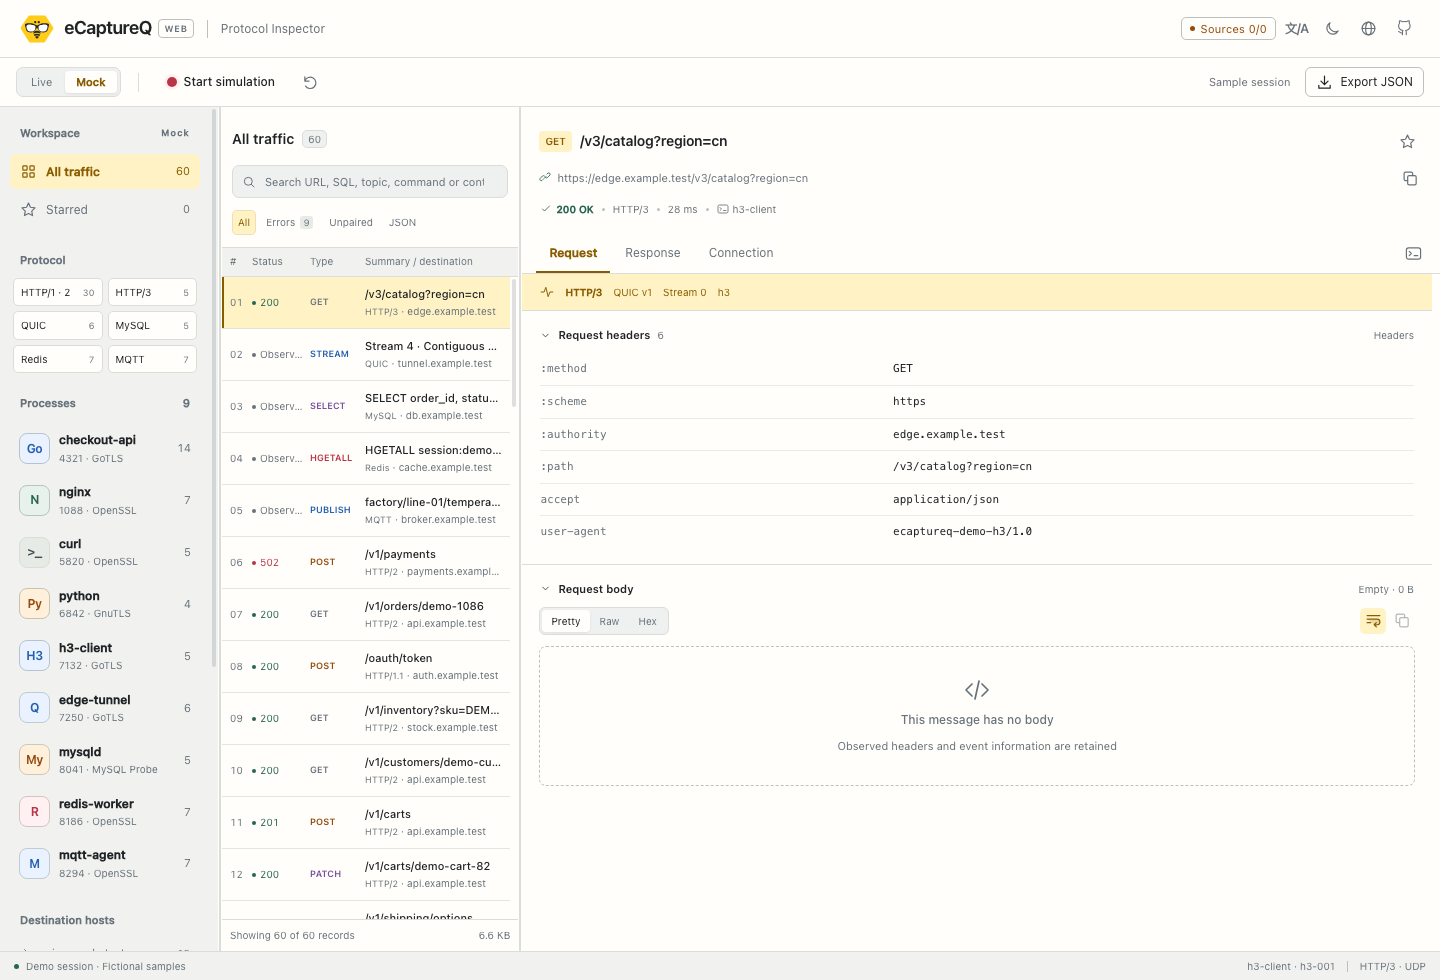 123
1. Left pane: choose the scope
| Control | What it selects |
|---|---|
| All traffic / 全部流量 | The normal record scope |
| Starred / 已标记 | Records starred in this page session |
| Protocols / 协议 | A protocol family; HTTP/1 and HTTP/2 share HTTP/1 · 2, HTTP/3 has its own entry |
| Processes / 进程 | Records attributed to the selected process; a paired record may match either captured process |
| Destination hosts / 目标主机 | The recorded target/host value, not a fresh DNS lookup |
A selected process, protocol, host, category and search term work together. For example, choosing a process and HTTP/3 and searching catalog keeps only records matching all three. Protocol buttons show families actually present in the current filtered scope; a missing button does not mean the product cannot view that protocol.
The category buttons above the list refine the scope:
- Errors / 异常: HTTP status 400 or higher, explicit failures/protocol errors, and partial capture that needs attention.
- Unpaired / 未配对: records without a correlated final response. This is not a duration or timeout filter.
- JSON: HTTP responses whose content type contains
json, or non-HTTP text payloads parseable as JSON. This is not a SQL query language.
Use the search field for URL, SQL, Topic, command, process information, Headers or captured content. Search is case-insensitive text matching within retained data, not a new capture request. Cmd/Ctrl + K inside eCaptureQ focuses this field.
Active conditions appear above the list. Click a condition's × to remove just that condition, Clear beside the Processes heading to remove the process condition, or Clear all to remove every condition including search and the Starred scope. Clearing filters does not delete records. When a list unexpectedly becomes empty, check these condition chips first.
2. Middle pane: understand a record
A row represents an application message, an associated exchange, or a protocol event. It is not one TCP packet. eCaptureQ consumes the messages provided upstream; it does not reassemble TCP traffic.
| Field | How to read it |
|---|---|
| Row number / star | Position in the filtered result including the page offset, or a page-local star; not a packet sequence number |
| Status | HTTP status code when observed, or a protocol/state label described below |
| Type | HTTP method such as GET, or an operation such as PUBLISH, GET for Redis, or a SQL/QUIC event |
| Summary / target | HTTP path, SQL excerpt, Redis command, MQTT topic, QUIC event or raw summary |
| Secondary line | Protocol, capture module/source for live records, and recorded host/endpoint |
| Duration | Available observed duration; — means unavailable, not zero. Mock durations are fictional |
| Size | Captured content size represented by the record, not total on-wire bandwidth |
A narrow middle pane can hide row number, duration and size to leave room for summaries. Widen it with the divider when needed. Dividers also accept arrow keys in the UI.
Unpaired means a matching final response has not been associated. Truncated / Partial capture means only part of the content is available. Observed means an event was captured, not that an operation succeeded. Redis Push and QUIC Reset describe their protocol events. An HTTP status is not a MySQL result code; check the relevant protocol detail tab.
Unknown process, missing PID, missing host, — and Not provided are deliberate unknown values. A response-only HTTP record says the request was not captured. A network endpoint is retained when Host/authority is absent; the UI does not invent a URL. Second-resolution timestamps are insufficient to calculate millisecond response time.
Select a row to load its details; use the up/down arrow keys to move through records. Live mode fetches up to 200 summaries per page and loads full detail on demand. Use the previous/next controls at the bottom of the list. A record may be evicted between list and detail requests; refresh the list if that is reported.
3. Right pane: inspect messages
HTTP tabs and representations
HTTP tabs are Request → Response → Connection (请求 → 响应 → 连接). Request/Response show their own Headers and body. A missing response is not replaced with fabricated content. Other protocols have dedicated tabs, such as SQL Query, Redis Command/Response, MQTT Packet or QUIC Stream Events; see Protocols & Details.
- Pretty / 格式化: formats JSON when possible. HTML uses an isolated, read-only preview with scripts and external resources disabled.
- Raw / 原文: the selected body representation without pretty-printing; image bodies show the captured image where supported.
- Hex: byte-oriented view for binary or textual content.
- Wrap: wraps long lines. Copy buttons copy the selected body representation or payload.
For encoded HTTP bodies, use Decoded / 解压后 (decompressed) and Original compressed / 原始压缩. This is HTTP body decompression, distinct from upstream TLS decryption and protocol parsing. gzip, deflate and br are handled when available; the shared service provides a bounded fallback. Damaged or truncated input, a 2 MiB per-layer output limit, a 5-second processing timeout or unsupported capabilities produce a visible reason and preserve the original bytes. Raw, Hex and body copy follow the selected representation. Export retains captured content rather than replacing it with decompressed output.
Images are decoded from captured bytes, never fetched again from the original URL. Compressed images are decompressed first. SVG is displayed only as an image. An incomplete or unsupported image produces an explanation instead of a network refetch.
Connection, process and TLS
Connection shows source, process name/PID, the captured process-command snapshot, connection identity, direction, transport and capture time. Both captured local processes can be shown for a paired exchange. Process ownership does not by itself establish client/server role. Command arguments may be truncated (up to 256 bytes captured); the UI marks that and preserves the captured raw representation in exported JSON.
Where supplied by a compatible collector, TLS handshake shows version, cipher suite, SNI, offered/negotiated ALPN, key-exchange group, signature algorithm, JA3 and JA4. These are handshake metadata and fingerprints, not a session-key viewer. Fields are not inferred from HTTP Host or another connection. The published eCapture v2.10.0 does not supply the newer official process-arguments/TLS fields; see compatibility requirements.
Copy, star and export
Copy the URL or cURL only when the request and required Host/authority were captured. Copying does not execute a request. Use the star in the detail heading to mark a record, then Starred in the left pane to find it again.
In Live mode, Export page JSON exports the filtered records on the current page, including fetched details; it does not export every page. In Mock mode, Export JSON exports the current filtered demo list. A record evicted during export causes an error; refresh and retry. Desktop uses a native save dialog, Web uses browser download. Desktop limits a single export to 64 MiB and clipboard content to 4 MiB.
Stars disappear on page reload or data-mode change and never protect records from eviction. Review exported data before sharing: real captures may contain credentials or personal information.
Practice: inspect a payment response
This exercise works without a collector in Mock mode:
- Click the Reset demo data / 重置模拟数据 icon to restore the bundled records, then select process
checkout-apiin the left pane. - Select protocol HTTP/1 · 2. The list now contains that process's HTTP/1.x and HTTP/2 records.
- Search
payments. Check that process, protocol and search conditions are all shown above the list. - Select the
POST /v1/paymentsrecord. The observed 502 is part of the fictional sample. - Open Response / 响应, then Pretty / 格式化 to inspect the sample JSON error and Headers. Open Connection / 连接 for its synthetic process/TLS context.
- Remove the search condition with ×. Click Clear beside Processes, then Clear all to restore the complete scope.
The sample's error text and timings are illustrative, not a diagnosis of a running service. Next, repeat the workflow with a source connected through Quick Start.
Refresh, theme and small screens
Pause refresh freezes UI record updates; background sources keep receiving and retention still applies. Resume to fetch current results. Switching Mock/Live also affects display, not reception.
Use the theme button for light/dark mode. The language menu offers English and 简体中文 while keeping captured text unchanged. On a narrow window, filters and detail use toggles/back navigation instead of three full columns. The documentation website works on phones; that does not imply a supported Android or iOS eCaptureQ client.