
eCaptureQ
Turn the network messages captured by eCapture into a searchable, correlated view you can inspect. Connect one or more sources, filter by process or protocol, and explore messages in a three-pane workspace.
Capture with eCapture, explore with Q
eCapture runs on the capture machine and handles collection and TLS decryption. eCaptureQ connects to its --ecaptureq WebSocket interface, correlates application messages and displays them. The two products run independently.
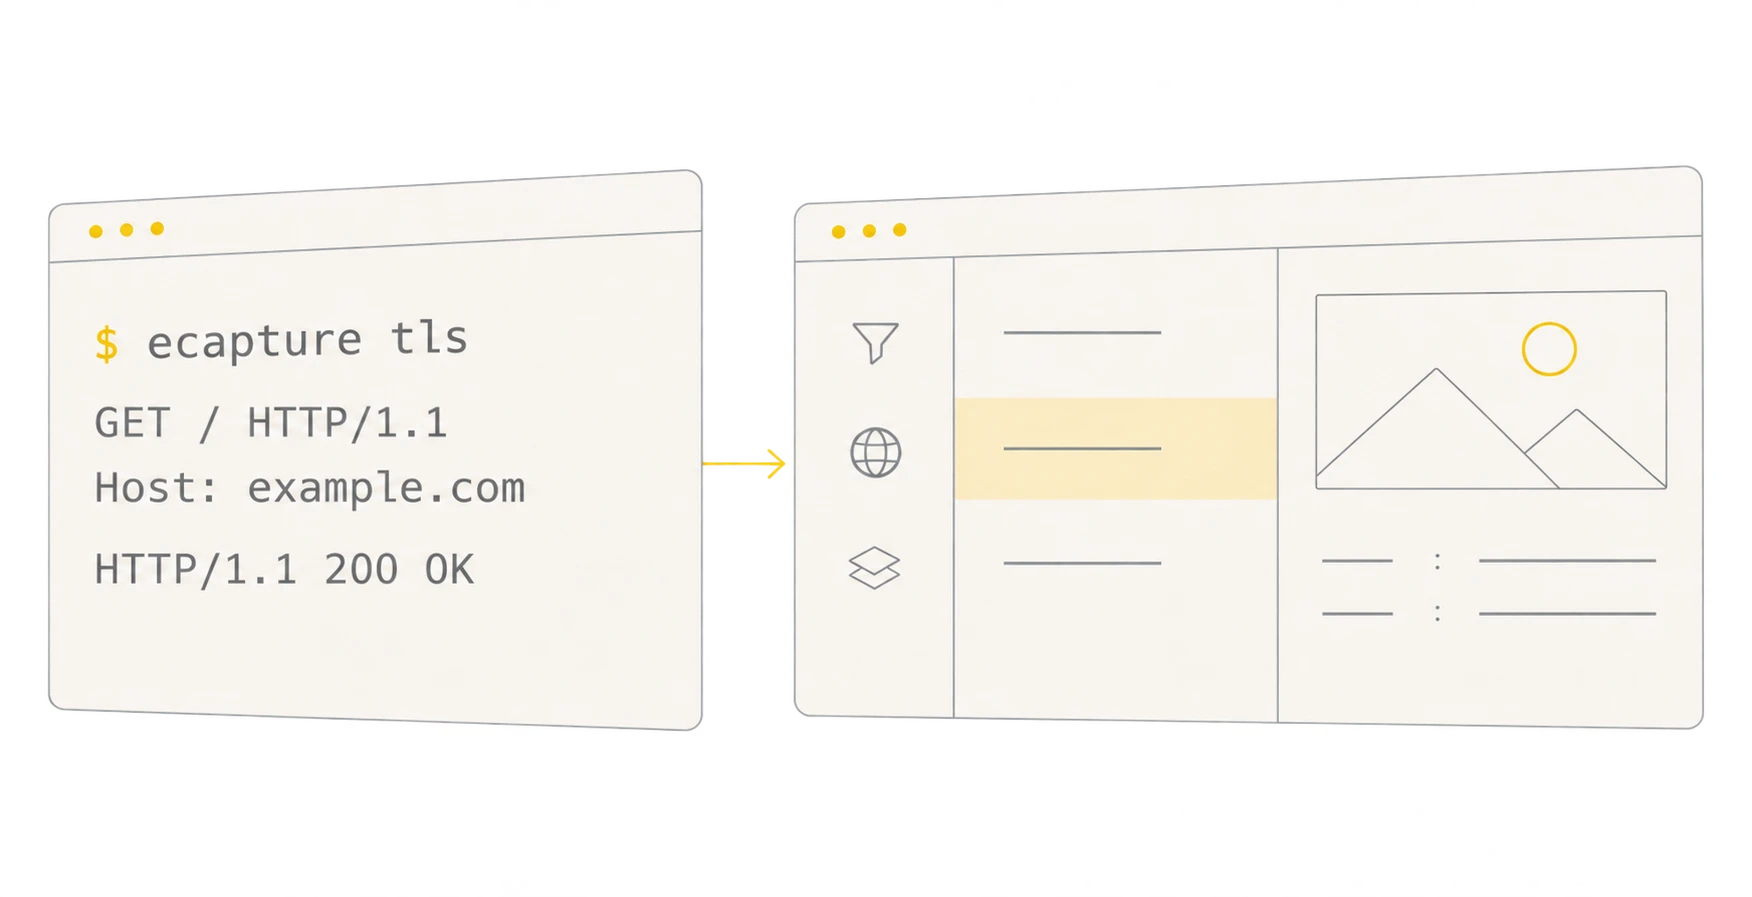
Application messages · --ecaptureq WebSocket
Use the left pane to narrow your search, the middle pane to select a record, and the right pane to inspect its details. Requests, responses, process and TLS information appear when supplied by the source.
Choose Desktop or Web
Both editions share the same analysis interface, support multiple sources, and run on Windows, Linux and macOS. Choose where you want to run Q; eCapture still needs a supported Linux or Android capture environment.
| eCaptureQ Desktop | eCaptureQ Web | |
|---|---|---|
| How you use it | Open an installed app on your workstation | Start the service, then open its page in a browser |
| Who connects to eCapture | The desktop application's machine | The Web service's machine |
| Get it | Install Desktop | Run Web |
First time? Try Mock mode without a collector, or follow Quick Start to connect your first live source. That guide walks through the commands, addresses and success checks.
Keep going
- Data Sources — connect collectors on the same machine, a LAN or a public endpoint.
- Interface Guide — learn the three panes and try a filtering exercise.
- Protocols & Details — see what each protocol can show.
- FAQ — troubleshoot connections, missing records and unpaired messages.